Destinations
Fast, powerful insights to manage crowds, support local businesses, identify overtourism pressures and influence positive traveller behaviour.

Our services for destinations & DMOs
Finding Overtourism Hotspots
The problem
Visitor arrivals have increased by over 40x in the last half century, increasing from 25 million arrivals in 1952, to over 1.4 billion by 2019. As the global middle mass grows, visa restrictions ease, and international travel becomes more accessible, cities are increasingly struggling to manage the number of tourists. One of the major challenges, facing almost every city struggling with overtourism, is determining the extent to which overtourism is a crisis, where its impact is more concentrated and how to effectively measure crowds.
Our solution
We offer a scalable, near-real time system capable of geo-spatially locating tourists at the city-level. The system is reproducible, scalable, and verifiable. It is able to visualise both historic dynamics and be useful for estimating predictive patterns in near-real time.
How it works
The tool we built combines government, industry and alternative data sources (e.g. review data), to simulate tourism traffic using a geo-spatial histogram placed on a time series.
- Filter for types of tourism traffic, such as restaurants, bars, attractions, and lodging
- Identify dynamics in demand, on a week-by-week basis
- Determine demand down to 200 sqms
- Compare cities on a case-by-case basis to ascertain extent of struggle
To ensure we meet the highest possible standards, we’ve tested and validated the results from this tool in multiple, separate control and standardised tests to ensure that the performance of our models are accurate (given the availability of data).
Plotting Establishments
Below is a map of establishments related to Porto’s travel and tourism sector, with filters that allow us to plot attractions, cafes, restaurants, bars, short-term rentals, among others.

MAPPING DEMAND OVER TIME
The figure below is a visualization we used to predict tourism traffic in Porto post-COVID. On July 1st, our model predicted Porto would exceed it’s 2019 record for tourist arrivals -which was confirmed by national statistics 4 months later.

Identifying Short-Term Rental Pressures
The problem
The explosion of short-term rentals around the world has contributed to ongoing conversations around overtourism and its impacts on local communities and populations. Mapping the extent of the problem, however, is difficult. Total supply of short-term rentals and their availability is not necessarily an indication of a crisis.
Our solution
We have built a tool that can identify the extent to which short-term rental markets are exerting pressures on local populations by examining local population density, volumetric building data, satellite imagery, and hotel lodging data.
How it works
Using data from the Joint Research Centre’s population census data, available data in short-term rental listings, data from Istat (among other public data warehouses), Equator generated an index that identifies the extent to which short-term rental markets are impacting the availability of housing for local residents. This system was first modelled for Venice then adapted to other cities, and can now be generated for over 40 cities worldwide.
- Policy-makers wanting to identify short-term rental pressures on local populations, potential land-zoning regulations and setting regulations on short- and long-term housing and hotels.
- Property Developers looking for data on investment opportunities, identifying less frequented, under-represented areas of a city.
- Booking Platforms & OTAs: looking to build in sustainability search index ranking systems to help destinations avoid concentrations of rental pressures or over-supply of accommodation.
GLOBAL HUMAN SETTLEMENT LAYER, JRC, 2023

Using publicly available data, like the Global Human Settlement Layer published by the Joint Research Centre at the European Commission, Equator is able to extrapolate the density of local populations in a designated area. In the figure below, is a snapshot of a visualization of what this population density looks like North Eastern Italy.
EQUATOR SHORT-TERM RENTAL DENSITY INDEX, VENICE, 2023

By layering analyses, Equator is able to build a reproducible, scalable index that identifies both number of short-term rentals within a 100,000 sqm volumetric space, but also the extent to which that exerts a pressure on the availability of housing for the local population. Yellow, in this instance, is extreme pressure, while purple is low.
Case Study:
Building a Destination-level Impact Calculator for NEOM
The Problem
The legacy information systems in the travel industry today are not designed for the demands of sustainable tourism. They were made by and for economists, for the purpose of modelling economic growth and contributions of tourism to GDP through satellite tourism accounts. Consequently, most measures of impact are complicated, slow and impractical; better suited for lengthy economic reports than the day-to-day management of sustainable tourism.
The Brief
In September 2022, NEOM contracted Equator to build a destination-level impact calculator capable of quantifying the social, economic and environment impacts of travel and tourism in the nature reserve.
The Design
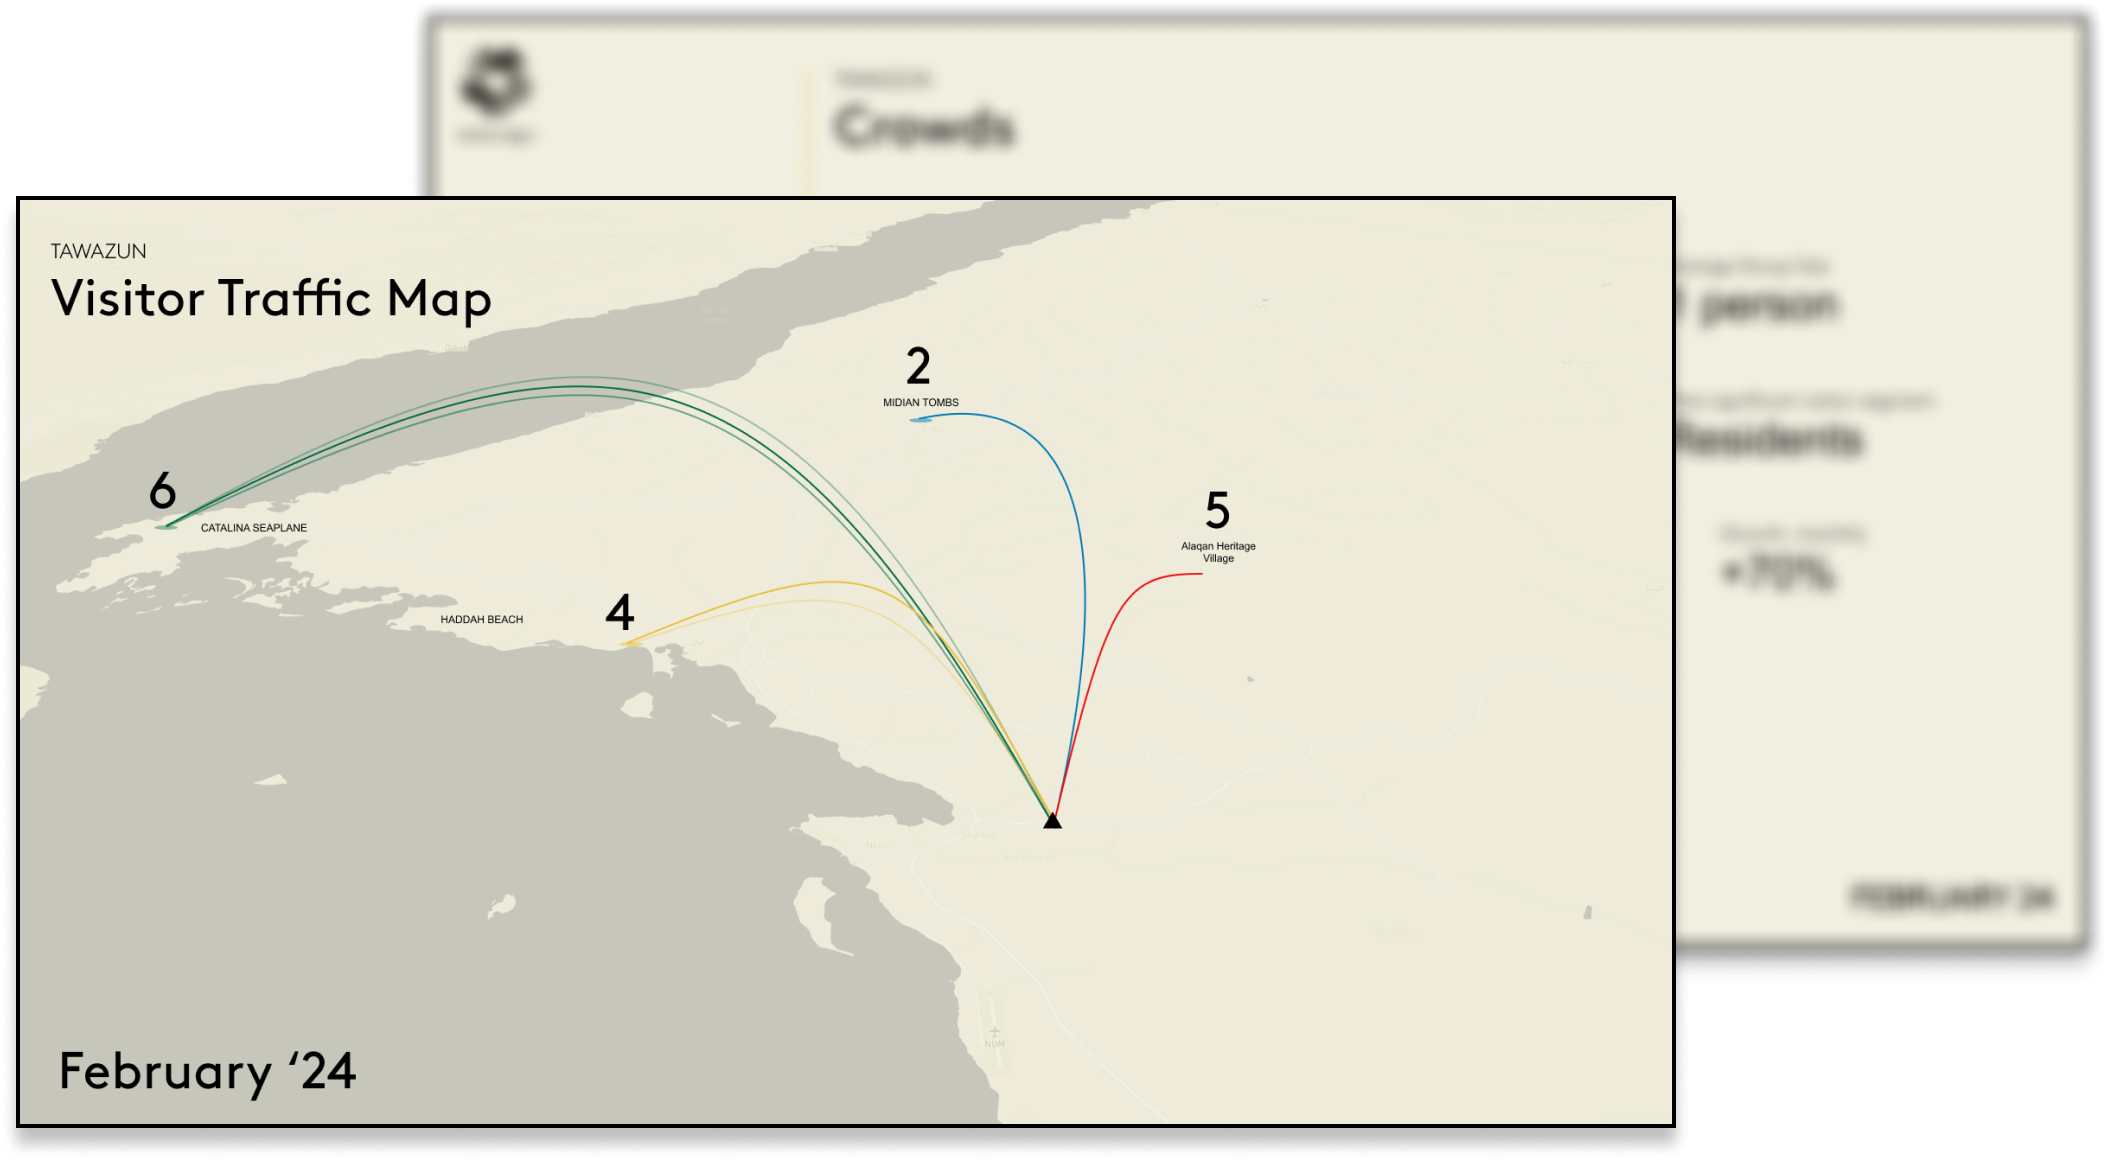
Within twelve months, Equator designed and built a first-of-its-kind impact calculator named Tawazun, after the Arabic word for ‘balance’.
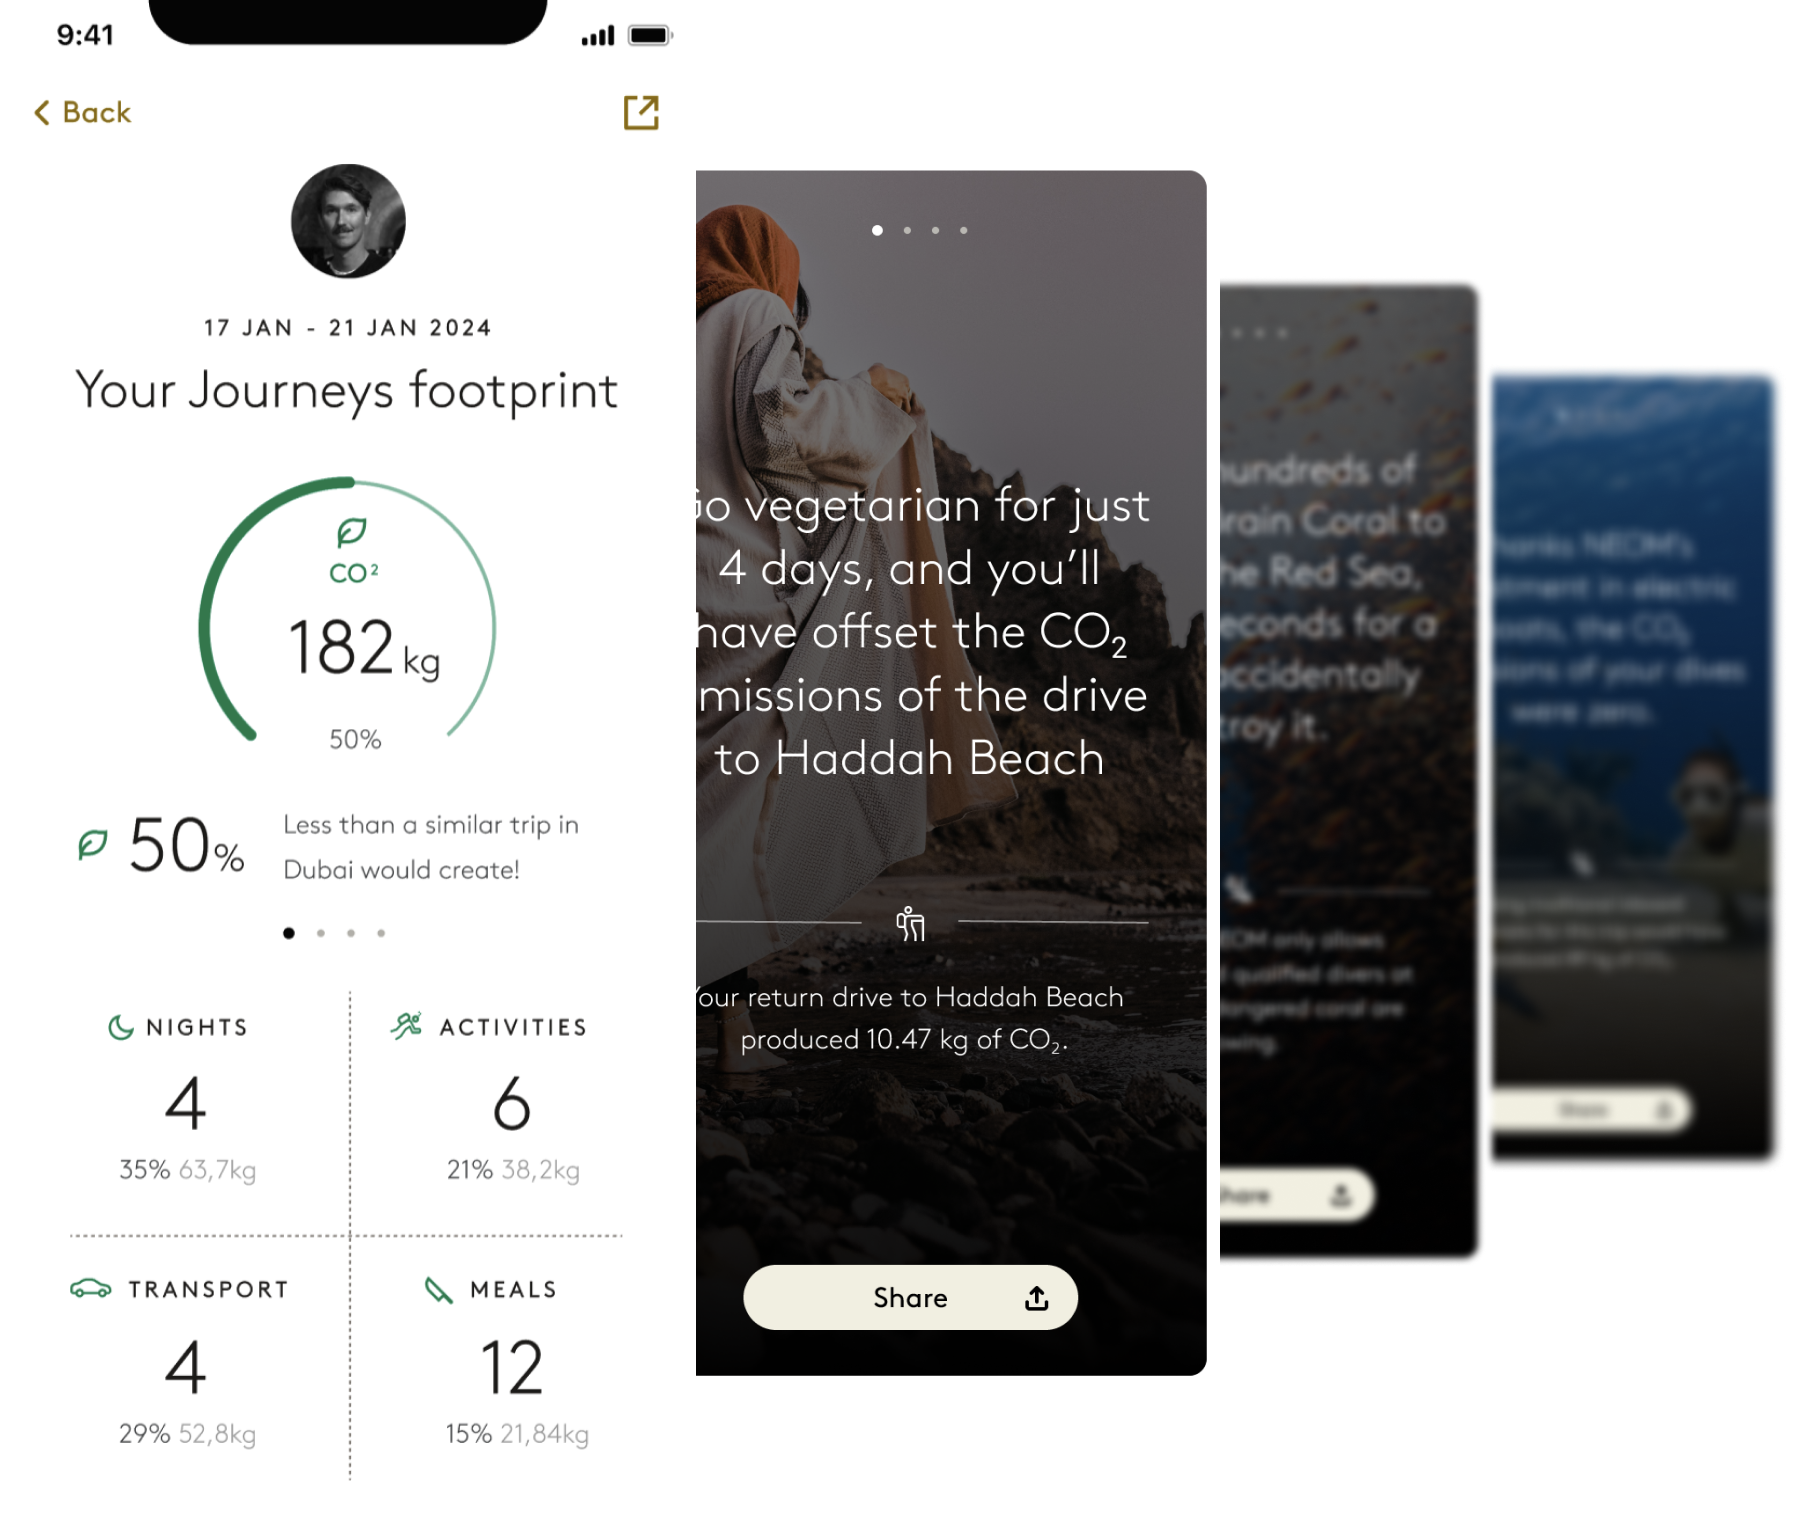
Tawazun is capable of providing data-driven insights instantly to help NEOM (1) manage the destination sustainably and, (2) produce a unique impact receipt for each tourist visiting the destination.
Not only is it capable of producing an impact receipt for each visitor, it has been designed to allow NEOM to build hyper-personalised experiences based on sustainability and impact.
It can identify surges in crowds, and inform NEOM’s booking platform of changing dynamics which allow for real-time changes in pricing, search index ranking or availability. Tawazun can also produce impact stories built around behavioural economics, that encourage or reward more sustainable behaviours.
Following successful tests, Tawazun was integrated into the broader NEOM digital ecosystem in 2024. It is scheduled to launch alongside the activation of the NEOM Nature Reserve.

